
You launched the site. The pages look sharp. Your offer is clear in your head. Then you log in a week later and ask the question almost every founder asks at some point: is anyone visiting, and if they are, are they the right people?
That’s where most small businesses go wrong. They check a traffic number, feel either encouraged or discouraged, and move on. But how to monitor web traffic isn’t really about counting visits. It’s about learning which pages attract buyers, which channels send time-wasters, and where your site leaks revenue.
If you run a low-volume, high-margin business, that distinction matters even more. A local service company, consultant, clinic, or niche e-commerce store doesn’t need a flood of random clicks. It needs the right visitors, on the right pages, taking the right actions.
Table of Contents
- Beyond Visitors You Need to Understand Them
- Choosing Your Traffic Monitoring Toolkit
- Getting Your Tracking Codes in Place
- Building a Dashboard That Tells a Story
- Interpreting What Your Traffic Is Telling You
- Troubleshooting and Automating Your Monitoring
Beyond Visitors You Need to Understand Them
A founder checks analytics and sees 100 visits for the week. The first reaction is often, "We need more traffic." Sometimes you do. Sometimes you already have enough of the right people visiting, but the site is doing a poor job turning interest into inquiries.
That distinction matters a lot in small, high-margin businesses. If one qualified lead can turn into a project worth thousands, traffic monitoring should help you separate serious buyers from casual readers. Raw visit counts will not do that. You need to know which pages attract prospects, which sources send people who take buying actions, and where good opportunities stall.

Why raw traffic numbers mislead founders
Traffic totals flatten important differences.
Someone who lands on a blog post, skims for 20 seconds, and leaves is not equal to someone who visits a service page, reads your pricing, checks your testimonials, and fills out a form. If both count as just "one visitor," you cannot tell whether your marketing is attracting buyers or tire-kickers.
I see this mistake all the time with small firms that sell expensive services. They celebrate a spike in traffic from a broad informational article, then wonder why sales stay flat. The answer is usually simple. The traffic was cheap in effort or cost, but weak in commercial intent.
A better rule is this:
If a metric does not help you decide what to improve, promote, or stop, it is probably a vanity metric.
Useful monitoring answers business questions such as:
- Which pages start visits that turn into leads
- Which traffic sources bring people who view pricing, case studies, or contact pages
- Which content attracts the right-fit prospect instead of low-intent visitors
- Where interested visitors hesitate or exit before contacting you
What useful monitoring looks like
Good monitoring connects attention to outcome.
For a small business, that usually means tracking more than sessions and pageviews. Watch the path people take. Do they move from a search landing page to a service page? Do they visit your pricing page before they submit a form? Do referral visitors from a directory bounce, while visitors from local search spend time on bottom-of-funnel pages? Those patterns are much closer to ROI than a top-line traffic chart.
This is also where trade-offs show up. A blog post that brings in a lot of visitors may still be worth keeping if it introduces qualified prospects to your brand and assists conversions later. On the other hand, a traffic source that sends volume but produces irrelevant inquiries can waste sales time, especially for lean teams.
The goal is not to admire traffic. The goal is to identify which visits have business value.
That changes the questions you ask. Instead of asking, "How many visitors did we get?" ask, "Which channel brings people who act like buyers?" Instead of asking, "Which page gets the most clicks?" ask, "Which page helps a prospect move one step closer to revenue?"
A store owner would not judge a day by how many people walked past the window. They would care who came in, who asked informed questions, and who bought. Your website should be measured with the same standard.
Choosing Your Traffic Monitoring Toolkit
Most founders don’t need more tools. They need the right few, chosen for the right reason.
Some businesses need deep event tracking and flexible reporting. Others need a simpler setup with fewer privacy headaches. If you operate in a regulated market, the wrong analytics stack can create compliance problems you only discover after the fact.
Pick tools based on business risk
GA4 is still the default for many businesses because it gives broad traffic and event visibility. If you want to monitor channels, page performance, and conversion paths in one system, it’s powerful.
But power comes with trade-offs. The interface can be more than a small business owner needs, and for companies in stricter jurisdictions, privacy questions aren’t academic. As Shoplazza’s overview of site traffic tools points out, businesses in regions with strict data protection laws like the EU may need a privacy-compliant option such as Matomo because some setups involving Google Analytics can create compliance risk if not configured correctly.
That means the right tool choice depends on more than price. It depends on what would hurt more in your business: limited reporting, setup complexity, or a legal cleanup later.
Don’t choose analytics software the way people choose a to-do app. Choose it based on reporting depth, compliance exposure, and whether you’ll actually use it every week.
Traffic Monitoring Tool Comparison
| Tool Type | Best For | Cost | Key Feature |
|---|---|---|---|
| GA4 | Businesses that want broad traffic and conversion tracking | Free | Event-based analytics and flexible reporting |
| Matomo | Businesses that need stronger privacy control | Paid or self-managed depending on setup | Data ownership and privacy-focused analytics |
| Built-in website platform stats | Founders who want simple visibility fast | Usually included with platform | Quick view of traffic basics without extra setup |
| Server log or host-level reporting | Technical teams that want raw access data | Varies | Direct traffic records from the hosting layer |
A few practical calls:
- Use GA4 if you want depth and are willing to invest time in setup.
- Use Matomo if privacy compliance sits near the top of your risk list.
- Use built-in platform stats if you need a quick pulse check, but don’t mistake them for a real decision system.
- Use server-side or host reporting as a supplement, not your main dashboard, unless you’re unusually technical.
For most founders, the worst option is not “the wrong tool.” It’s half-installing three tools and trusting none of them.
Getting Your Tracking Codes in Place
A lot of small business owners reach this point, paste in a tracking code, see pageviews coming through, and assume the job is done. Then six months later they still cannot answer a basic question: which traffic source brings actual buyers, not just people who browse and leave.
That problem starts in setup.
If your tracking only measures visits, you will overvalue channels that drive curiosity and miss the ones that produce qualified calls, booked consultations, and closed deals. For a low-volume, high-margin business, that mistake gets expensive fast. Ten visits from the right audience can matter more than 500 from the wrong one.
![]()
Direct install versus tag manager
You have two practical ways to install tracking. Put the base script directly on the site, or install it through a tag manager.
Direct install is fine for a simple site with a few pages and one primary conversion action. It is usually faster to launch, and there is less that can break during setup. The trade-off is maintenance. Every new event, ad platform tag, or call tracking script may require another site edit.
A tag manager takes a little more care up front, but it usually pays for itself once you want to track more than pageviews. If you expect to measure form submits, appointment clicks, checkout starts, phone taps on mobile, or traffic from multiple ad platforms, a tag manager gives you more control without asking your developer to touch the site every time.
Use a simple decision rule:
- Choose direct install if your site is small, your tracking needs are limited, and you want the fastest path to reliable basics.
- Choose a tag manager if you plan to test campaigns, add events over time, or need cleaner control over multiple tags.
Whichever route you choose, complete the setup in this order:
- Create the analytics property in your chosen platform.
- Install the base tag on every page, either directly or through your tag manager.
- Verify it fires on your main entry pages, service pages, contact page, and thank-you page.
- Set up your core conversion events before building reports.
What to track from day one
Founders often ask whether they should track everything. No. Track the actions that signal buying intent.
For a local service business, a homepage view is weak evidence. A pricing-page visit, consultation request, financing-page click, or completed lead form tells you much more about commercial value. Those are the signals that help you judge traffic quality.
Start with actions like these:
- Form submissions on contact, quote, or service pages
- Quote or consultation requests
- Checkout starts for e-commerce
- Key CTA clicks such as “book now,” “get pricing,” or “call today”
- Thank-you page views that confirm a completed action
The goal is not more events. The goal is cleaner decisions.
If organic search sends fewer visitors than social, but those visitors request estimates at a much higher rate, you have learned something useful. If paid traffic drives lots of landing page visits but no booked calls, that traffic may be cheap and still unprofitable. Good tracking lets you spot that difference early.
A short walkthrough helps if the setup feels abstract:
If you use WordPress, Shopify, or Squarespace, the menu names will vary. The standard does not. Install the tag once, confirm it loads on the pages that matter, then test your important actions yourself. Submit the form. Click the booking button. Reach the thank-you page. If your analytics platform does not record those actions, fix that before you trust any traffic report.
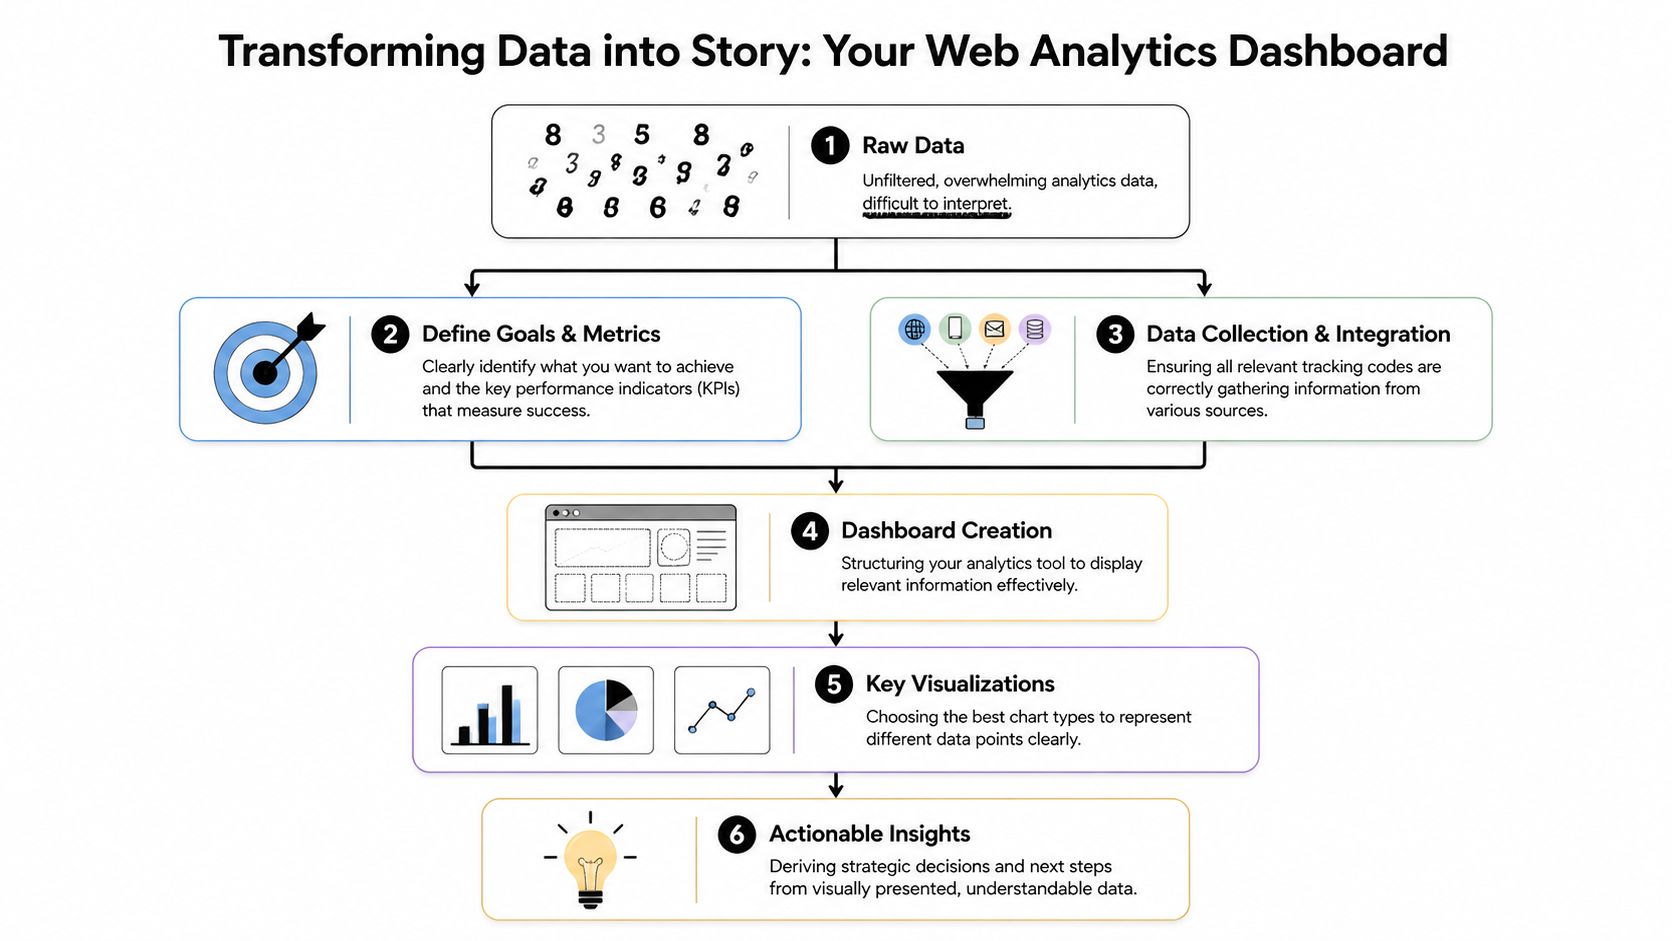
Building a Dashboard That Tells a Story
A default analytics account gives you data. It doesn’t give you judgment.
The right dashboard should help you answer business questions quickly, not admire charts. For a founder, the best dashboard is usually a one-page view that tells you whether traffic quality is improving, stagnating, or drifting toward the wrong audience.
Start with five business questions
A dashboard becomes useful when every widget earns its place. Keep only the views that help you decide what to do next.
Start with these questions:
- How many sessions are we getting
- Where are those sessions coming from
- Which pages bring people in
- Which actions signal buyer intent
- How does this compare with the previous period
A session is one of the few web metrics that deserves first-page treatment. HubSpot defines sessions as a series of user activities on your site within a 30-minute window, and notes that healthy sites often average 2 to 3 pages per session and 2 to 3 minutes of duration in many cases. It also recommends monitoring sessions by source to understand which channels bring engaged visitors in its web traffic analytics documentation.
That “by source” part matters more than the top-line number. Organic, referral, direct, email, and paid traffic often behave very differently. If one source sends short, shallow visits and another sends fewer but better sessions, the smaller source may deserve more investment.
The simplest dashboard that works
A founder dashboard doesn’t need twenty charts. It needs a clean reading of signal over noise.
A strong version includes:
| Dashboard Element | Why it matters |
|---|---|
| Sessions trend | Shows whether overall demand is rising or falling |
| Sessions by source | Reveals where engaged traffic comes from |
| Top landing pages | Shows which pages attract attention first |
| Conversion actions | Connects visits to business outcomes |
| Period comparison | Helps you spot direction, not just totals |
A good dashboard answers “What changed?” A great dashboard also answers “Why should I care?”
One more rule. Keep your dashboard review short. If it takes longer than a few minutes to understand the story, the dashboard is doing too much. Founders need signal they can act on before the next meeting, not a new hobby in data analysis.
Interpreting What Your Traffic Is Telling You
Analytics becomes valuable when you stop reading numbers as verdicts and start reading them as clues.
A founder sees “high bounce rate” and thinks failure. An analyst sees a starting point: wrong message, wrong audience, weak page structure, slow load, unclear offer, or a mismatch between the promise in the source and the reality on the page.
How to read bounce rate without guessing
Bounce rate is the percentage of single-page visits. It’s useful because it often exposes friction fast.
According to Semrush’s website metrics overview, bounce rate averages 40 to 60% across industries, and a rate above that on a key landing page is a warning sign. If your services page shows a 70% bounce rate, that points to a problem in messaging, pricing clarity, or user experience.
That doesn’t mean every high bounce is bad. A visitor may get the answer they needed and leave. But on a page meant to generate leads, high bounce with low inquiry volume usually means something is off.
Use this diagnostic sequence:
- Check the source. Did the traffic come from a keyword or campaign that mismatches the offer?
- Check the message. Does the headline confirm what the visitor expected?
- Check the path. Is the next step obvious, credible, and easy to take?
Ask “why?” three times for every bad metric. The first answer is usually too shallow to fix the real issue.
Patterns that point to revenue problems
Some combinations of metrics are more revealing than any single number.
- High traffic and weak inquiries often means the content attracts interest but not buyers.
- Strong engagement on one page and weak performance elsewhere usually means that page has a sharper promise than the rest of the site.
- A spike from one article or referral source often signals a topic or channel worth expanding.
- Traffic to informational pages without movement to service or product pages suggests your internal linking or calls to action need work.
Low-volume businesses require discipline. If you only get a modest number of visits, each wrong click costs attention. You can’t afford to optimize for empty traffic.
The better question isn’t “Which page has the most visitors?” It’s “Which page attracts people who act like future customers?”
Troubleshooting and Automating Your Monitoring
Even a well-built setup breaks. Plugins update, scripts disappear, pages change, and reports suddenly look wrong.
The fix is to stop treating analytics as something you manually inspect only when you feel nervous. Build a baseline, then let the system alert you when something unusual happens.
Fix the common failures first
If traffic suddenly drops to zero, don’t start with panic. Start with the boring checks.
- Check whether the tracking code still exists on the site after a theme or platform update.
- Compare page coverage to make sure the script appears on all key templates.
- Test a conversion action yourself and confirm it appears in the analytics tool.
- Review date ranges and filters before assuming performance changed.
If two tools disagree, that doesn’t always mean one is broken. Different platforms measure activity differently. What matters is whether your primary tool is consistent enough to support decisions.
Use alerts so you stop babysitting dashboards
The smarter model comes from network monitoring, not just marketing analytics. As Paessler’s guide to traffic analysis methods explains, the practical principle is to establish a baseline of normal traffic patterns first, then set meaningful thresholds so you catch real problems without creating alert fatigue.
That approach works for founders too. Watch for significant deviations, not every wiggle.
Useful alerts include:
- Organic traffic drops on pages that usually bring leads
- Sharp spikes to a specific page that may signal an opportunity
- Conversion tracking failures when a key action suddenly stops recording
- Channel anomalies when one source behaves far outside its normal range
The point of automation isn’t more notifications. It’s fewer pointless dashboard checks and faster response when something matters.
If you want a practical SEO system that goes beyond analytics and helps you turn traffic insights into content that attracts better leads, Agency Secrets is worth a look. It’s built for business owners who want clear execution, stronger organic visibility, and a simpler path to revenue without hiring a full agency team.
Authored using Outrank
Leave a Reply